买服务器上雨云
 由超大带宽雨云提供赞助
借助工具
事件查看器和gflags(需安装WinDbg)
gflags Microsoft Store安装, 点我前往下载PowerShell输入命令winget install Microsoft.WinDbg说明
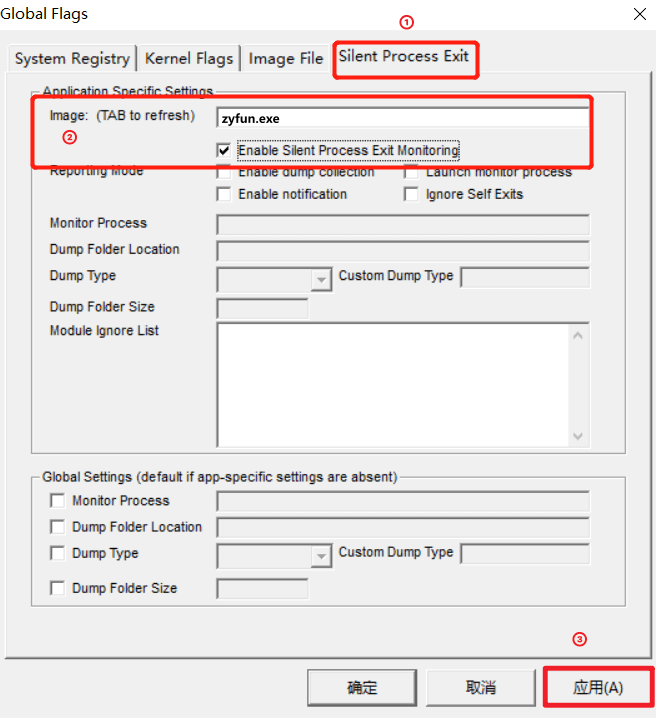
设置 image 前需启动软件
Silent Process Exit -> image(输入进程名 需要按tab生效) -> Enable Silent Process Exit Monitoring(勾选进程监听) -> 应用
此处正常复现故障即可, 无特殊要求
win + r输入eventvwr.msc打开事件查看器事件查看器->Windows日志->应用程序windows已经帮你分析好了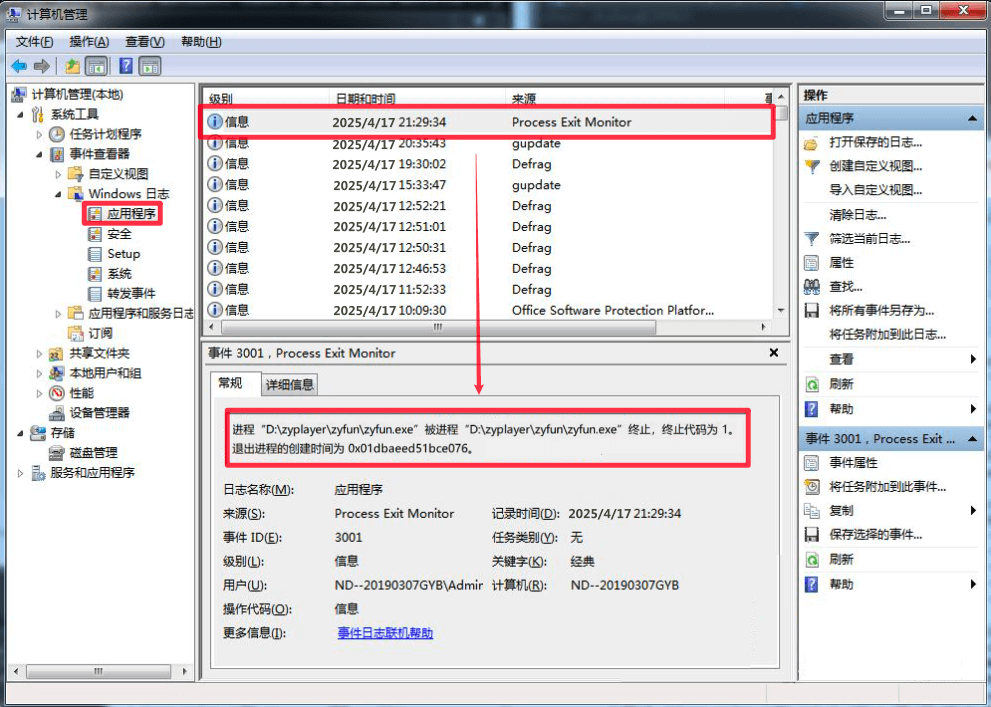
借助工具
火绒剑
火绒剑 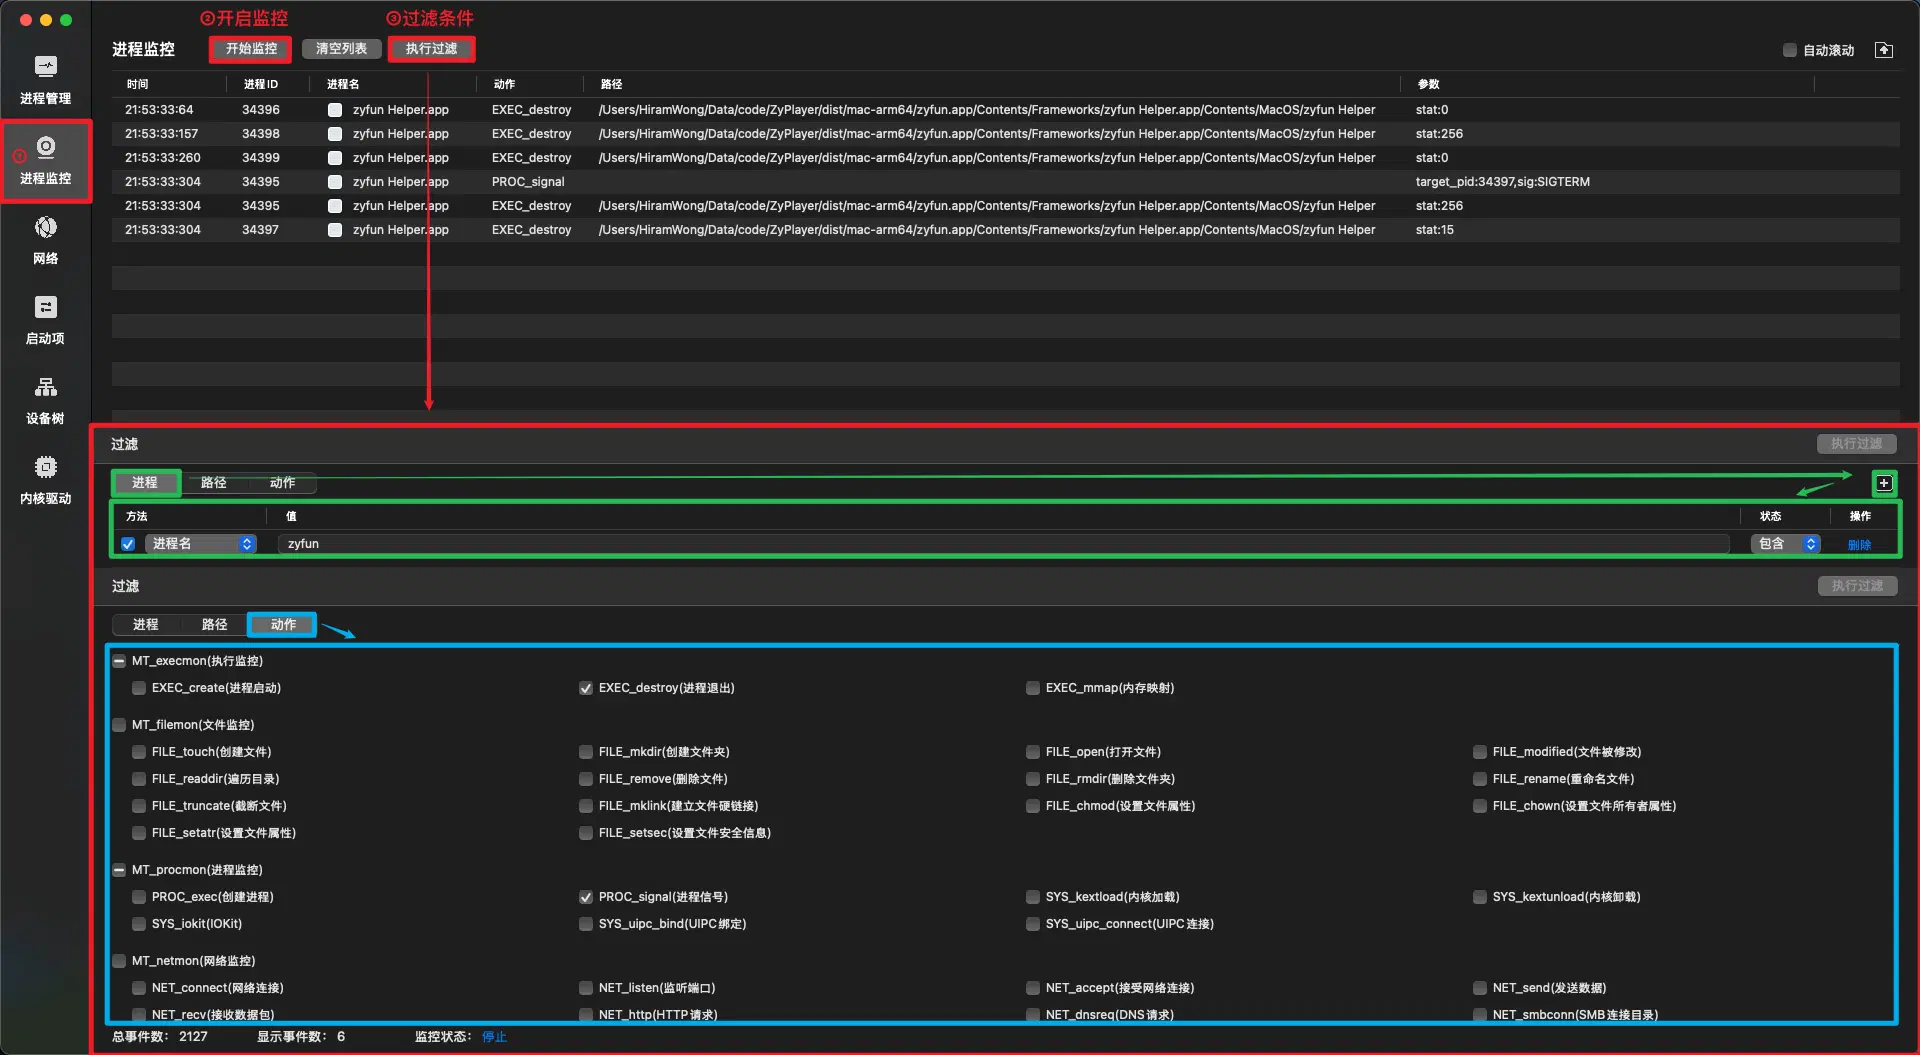
此处正常复现故障即可, 无特殊要求
进程ID 34395 向目标进程ID 34397 发送了 SIGTERM 信号(终止信号)
这表明进程 34397 是被进程 34395 显式终止的,而进程 34397 的退出状态码是 stat:15,这与 SIGTERM 信号的预期行为一致

结论: 子进程是被软件自己kill的, 需从软件本身排查原因借助工具
audit
audit 在Debian|Ubuntu基础的系统上(如统信|麒麟)
sudo apt update
sudo apt install auditd在欧拉|龙晰基础的系统上
sudo yum update
sudo yum install audit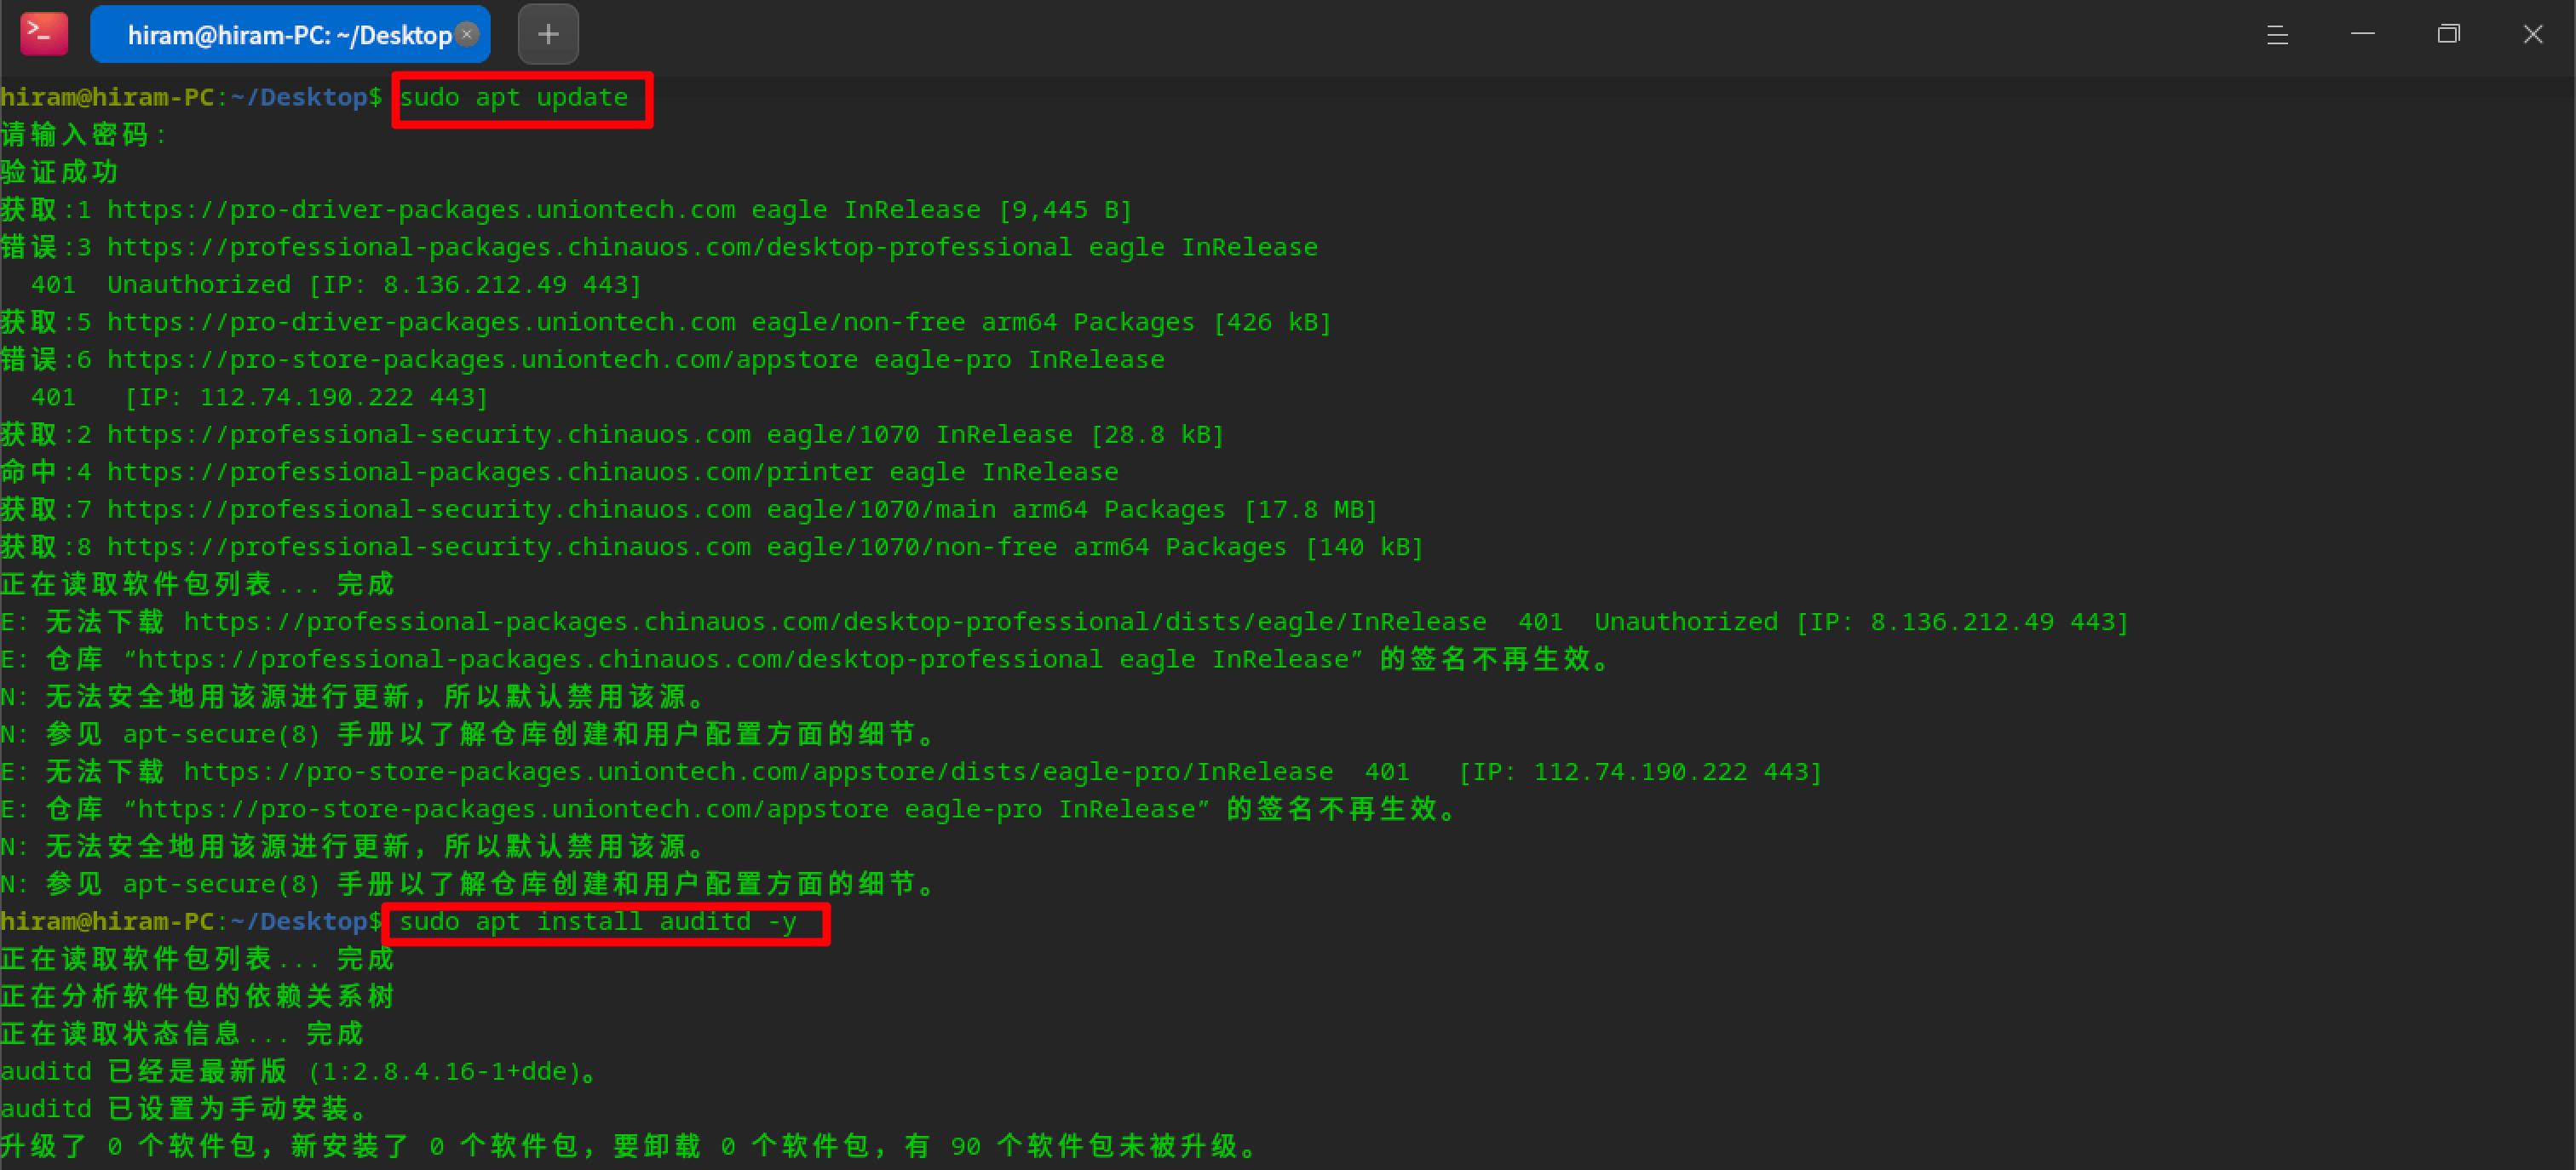
audit sudo systemctl start auditd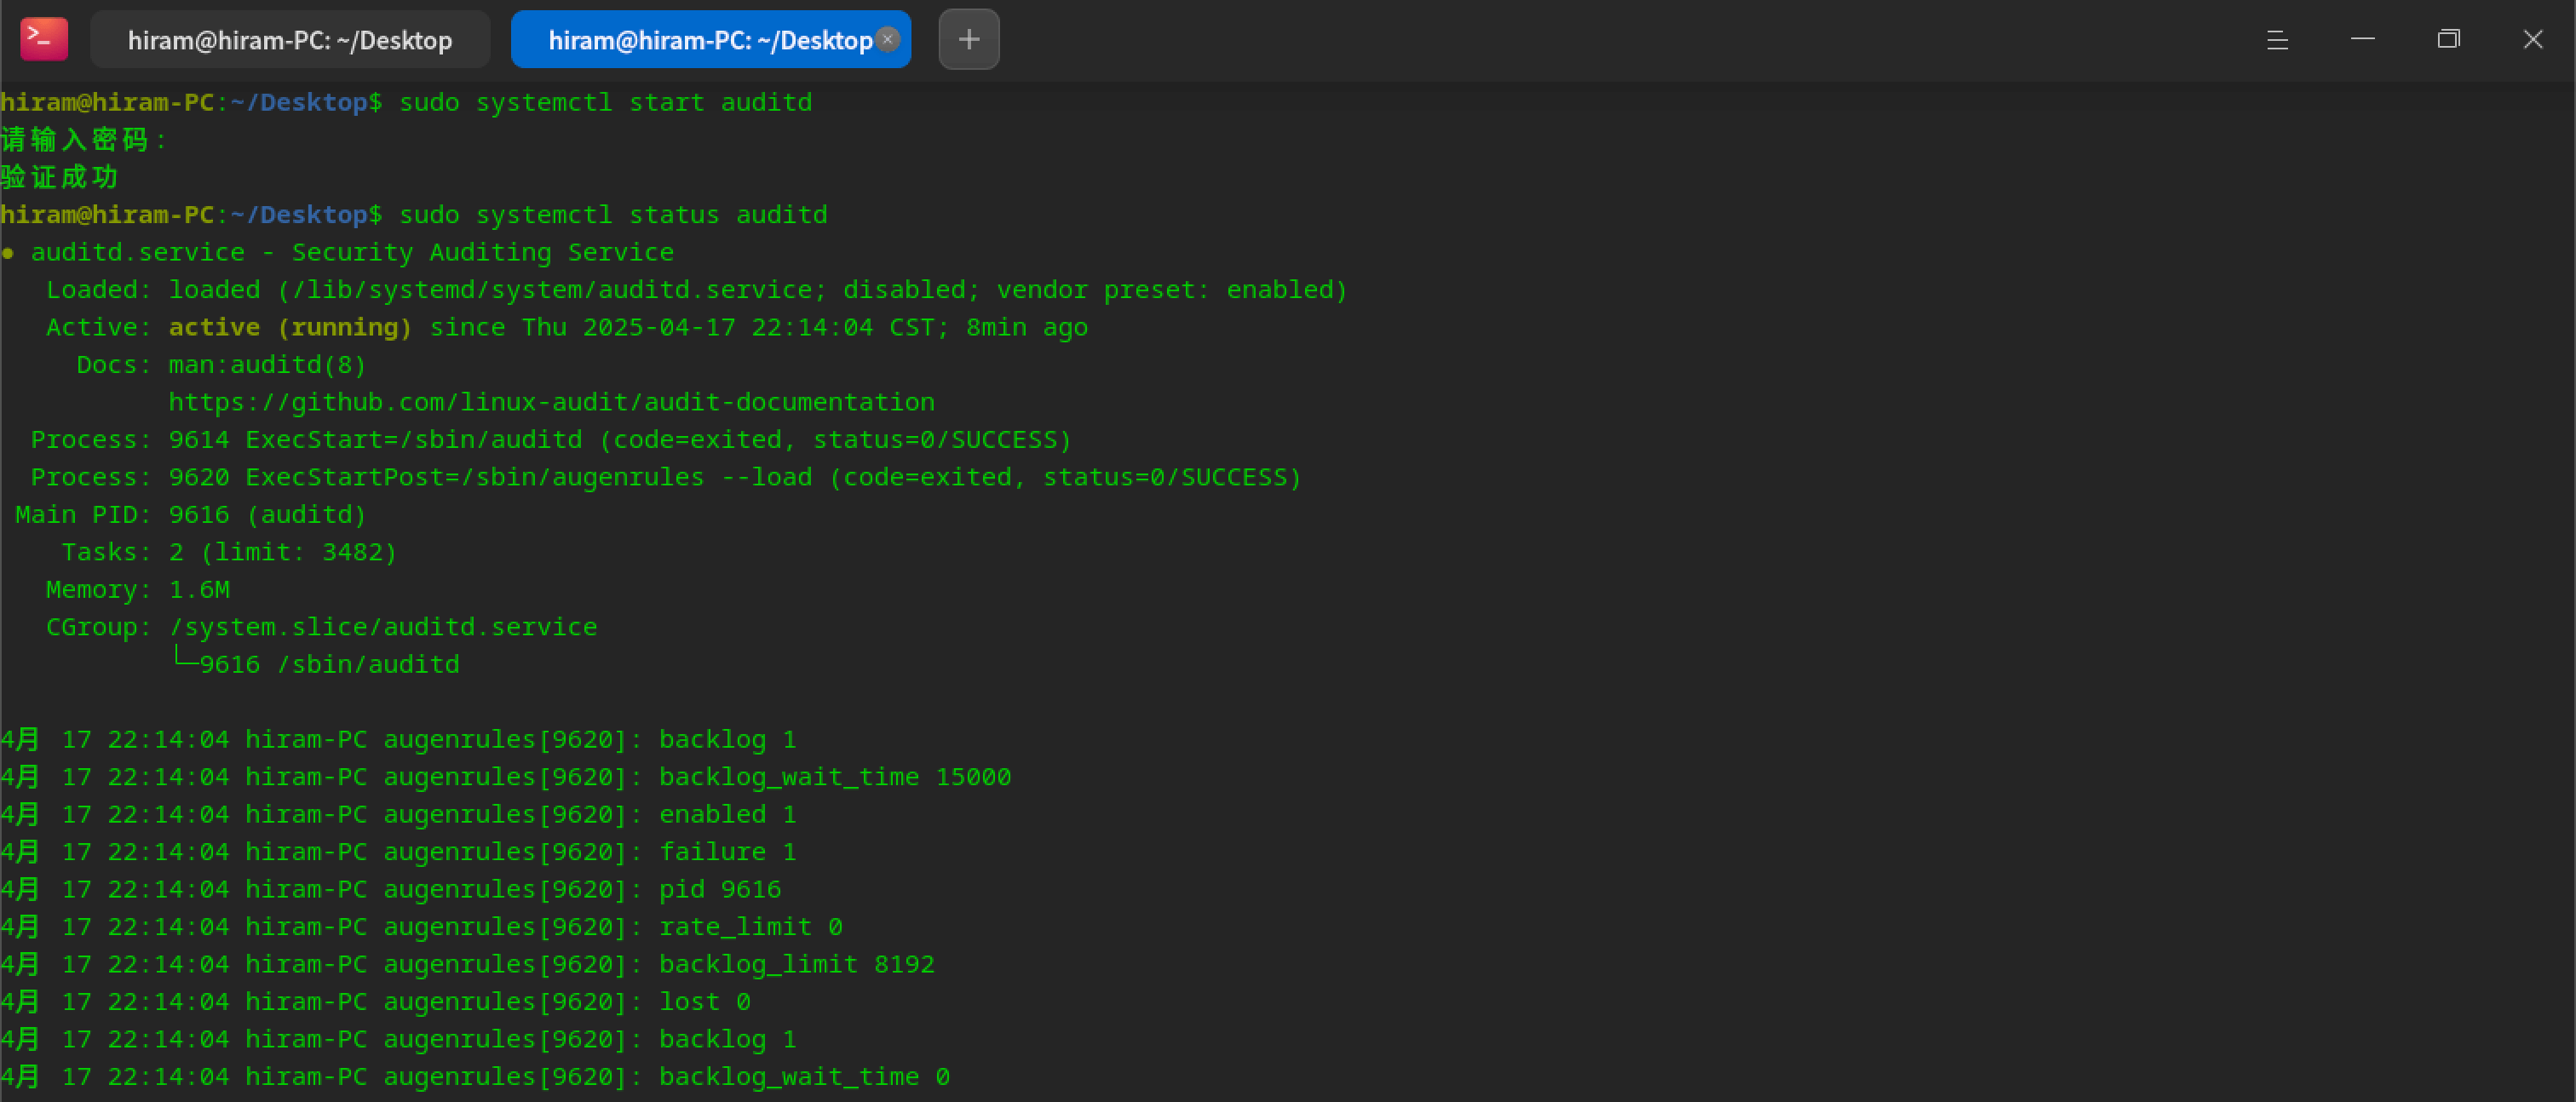
audit规则 参数说明
使用auditctl -h查看
sudo auditctl -a exit,always -F arch=b64 -S kill -k zyfun_kill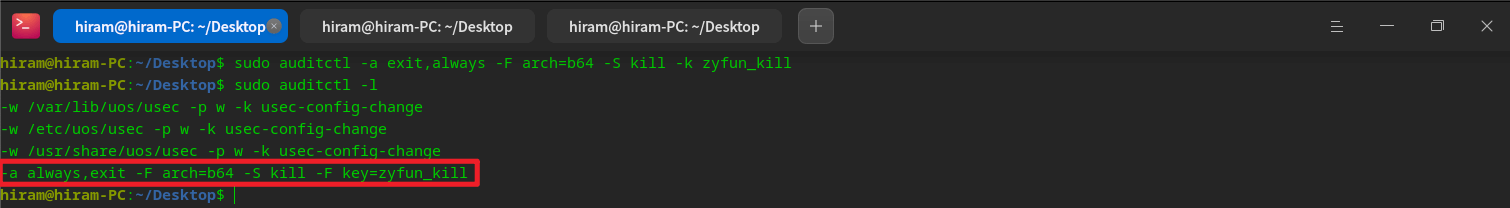
此处正常复现故障即可, 无特殊要求
参数说明
使用ausearch -h查看
sudo sudo ausearch -k zyfun_kill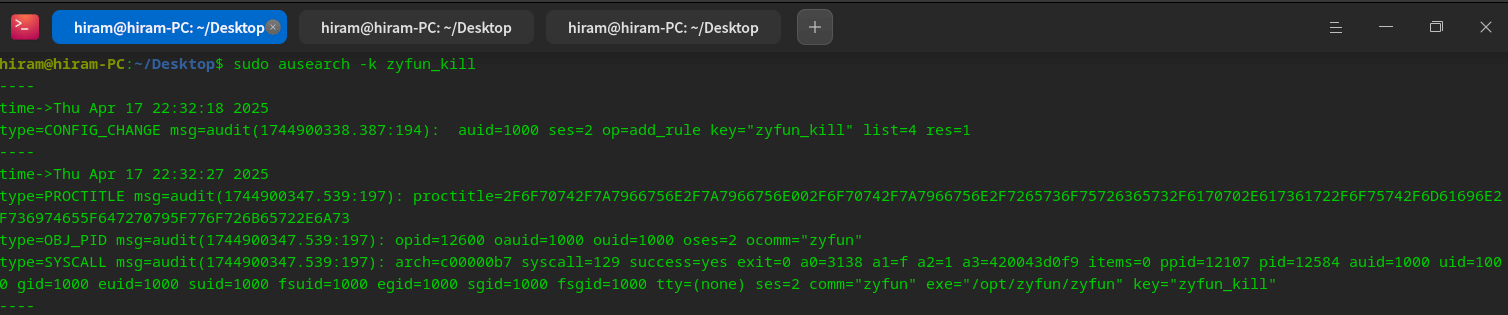
type=PROCTITLE msg=audit(1744900347.539:197): proctitle=2F6F70742F7A7966756E2F7A7966756E002F6F70742F7A7966756E2F7265736F75726365732F6170702E617361722F6F75742F6D61696E2F736974655F647270795F776F726B65722E6A73

type=PROCTITLE: 进程标题信息
proctitle: 进程命令行参数(16进制), 解码后为:`/opt/zyfun/zyfun /opt/zyfun/resources/app.asar/out/main/site_dropy_worker.js`type=OBJ_PID msg=audit(1744900347.539:197): opid=12600 oauid=1000 ouid=1000 oses=2 ocomm="zyfun"
type=OBJ_PID: 表示目标进程的信息
opid=12600: 目标进程的 PID 为 12600
oauid=1000: 目标进程的审计用户 ID(auid)为 1000
ocomm="zyfun": 目标进程的命令名为 zyfuntype=SYSCALL msg=audit(1744900347.539:197): arch=c00000b7 syscall=129 success=yes exit=0 a0=3138 a1=f a2=1 a3=420043d0f9 items=0 ppid=12107 pid=12584 auid=1000 uid=1000 gid=1000 euid=1000 suid=1000 fsuid=1000 egid=1000 sgid=1000 fsgid=1000 tty=(none) ses=2 comm="zyfun" exe="/opt/zyfun/zyfun" key="zyfun_kill"
type=SYSCALL:表示这是一个系统调用事件
arch=c00000b7:表示系统调用的架构为 64 位(b64)
syscall=129:表示系统调用的编号为 129,对应于 kill 系统调用
success=yes:表示系统调用成功执行
exit=0:表示系统调用的返回值为 0,表示成功
a0=3138:第一个参数,表示目标进程的 PID(opid)
a1=f:第二个参数,表示发送的信号编号(SIGTERM,值为 15)
a2=1:第三个参数,表示信号的来源(1 表示来自用户空间)
comm="zyfun":调用 kill 系统调用的进程名为 zyfun
exe="/opt/zyfun/zyfun":调用 kill 系统调用的可执行文件路径
key="zyfun_kill":这条日志与您设置的键值 zyfun_kill 匹配1. 进程被发送了 SIGTERM 信号
- syscall=129 表示这是一个 kill 系统调用
- a1=f 表示发送的信号编号为 15,即 SIGTERM
- a0=3138 表示目标进程的 PID 为 12600。
2. 信号是由进程自身发送的
- comm="zyfun" 和 exe="/opt/zyfun/zyfun" 表示调用 kill 系统调用的进程是 zyfun 本身
- ppid=12107 和 pid=12584 表示父进程和当前进程的 ID进程是被自身终止的, 而不是被其他软件杀掉(需从软件本身排查原因)
会生成dmp文件
google breakpad工具 git clone https://chromium.googlesource.com/breakpad/breakpad
cd breakpad
./configure && make
make install路径说明
electron 版本的 symbolssymbolsarm架构-electron v37.1.0版本) 则下载 electron-v37.1.0-darwin-arm64-symbols.zipyarn install minidump路径说明
logs/crash/)const path = require('node:path')
const minidump = require('minidump')
// https://github.com/electron/electron/releases
// 需修改symbolPaths和file两个地址
const symbolPaths =
'/Users/xxx/Downloads/electron-v37.1.0-darwin-arm64-symbols/breakpad_symbols'
const file =
'/Users/xxx/Library/Application Support/zyfun/log/crash/pending/a7c15378-df3d-4810-a832-50ba6ae95ad6.dmp'
minidump.walkStack(file, symbolPaths, (err, result) => {
if (err) {
console.error('Error reading minidump:', err)
return
}
fs.writeFileSync('dump.txt', result.toString())
})会生成一个dump.txt文件
# node后面的路径改成保存的文件名
node minidump_crash.jsminidump会生成堆栈信息和原因(Crash reason字段) 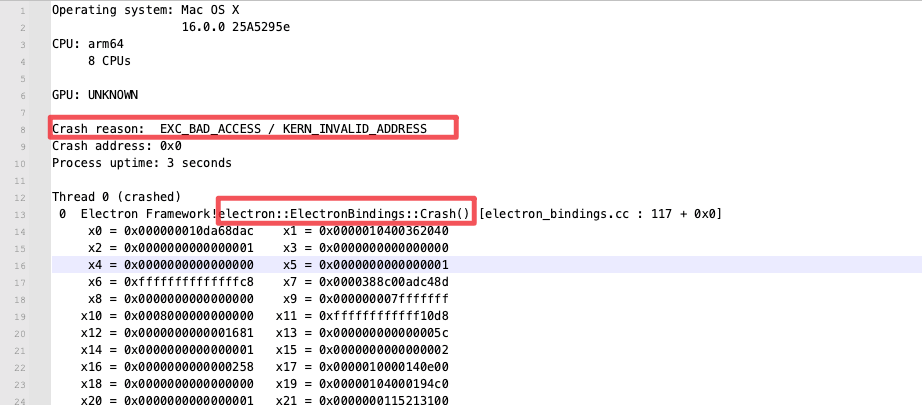 不会分析直接扔给
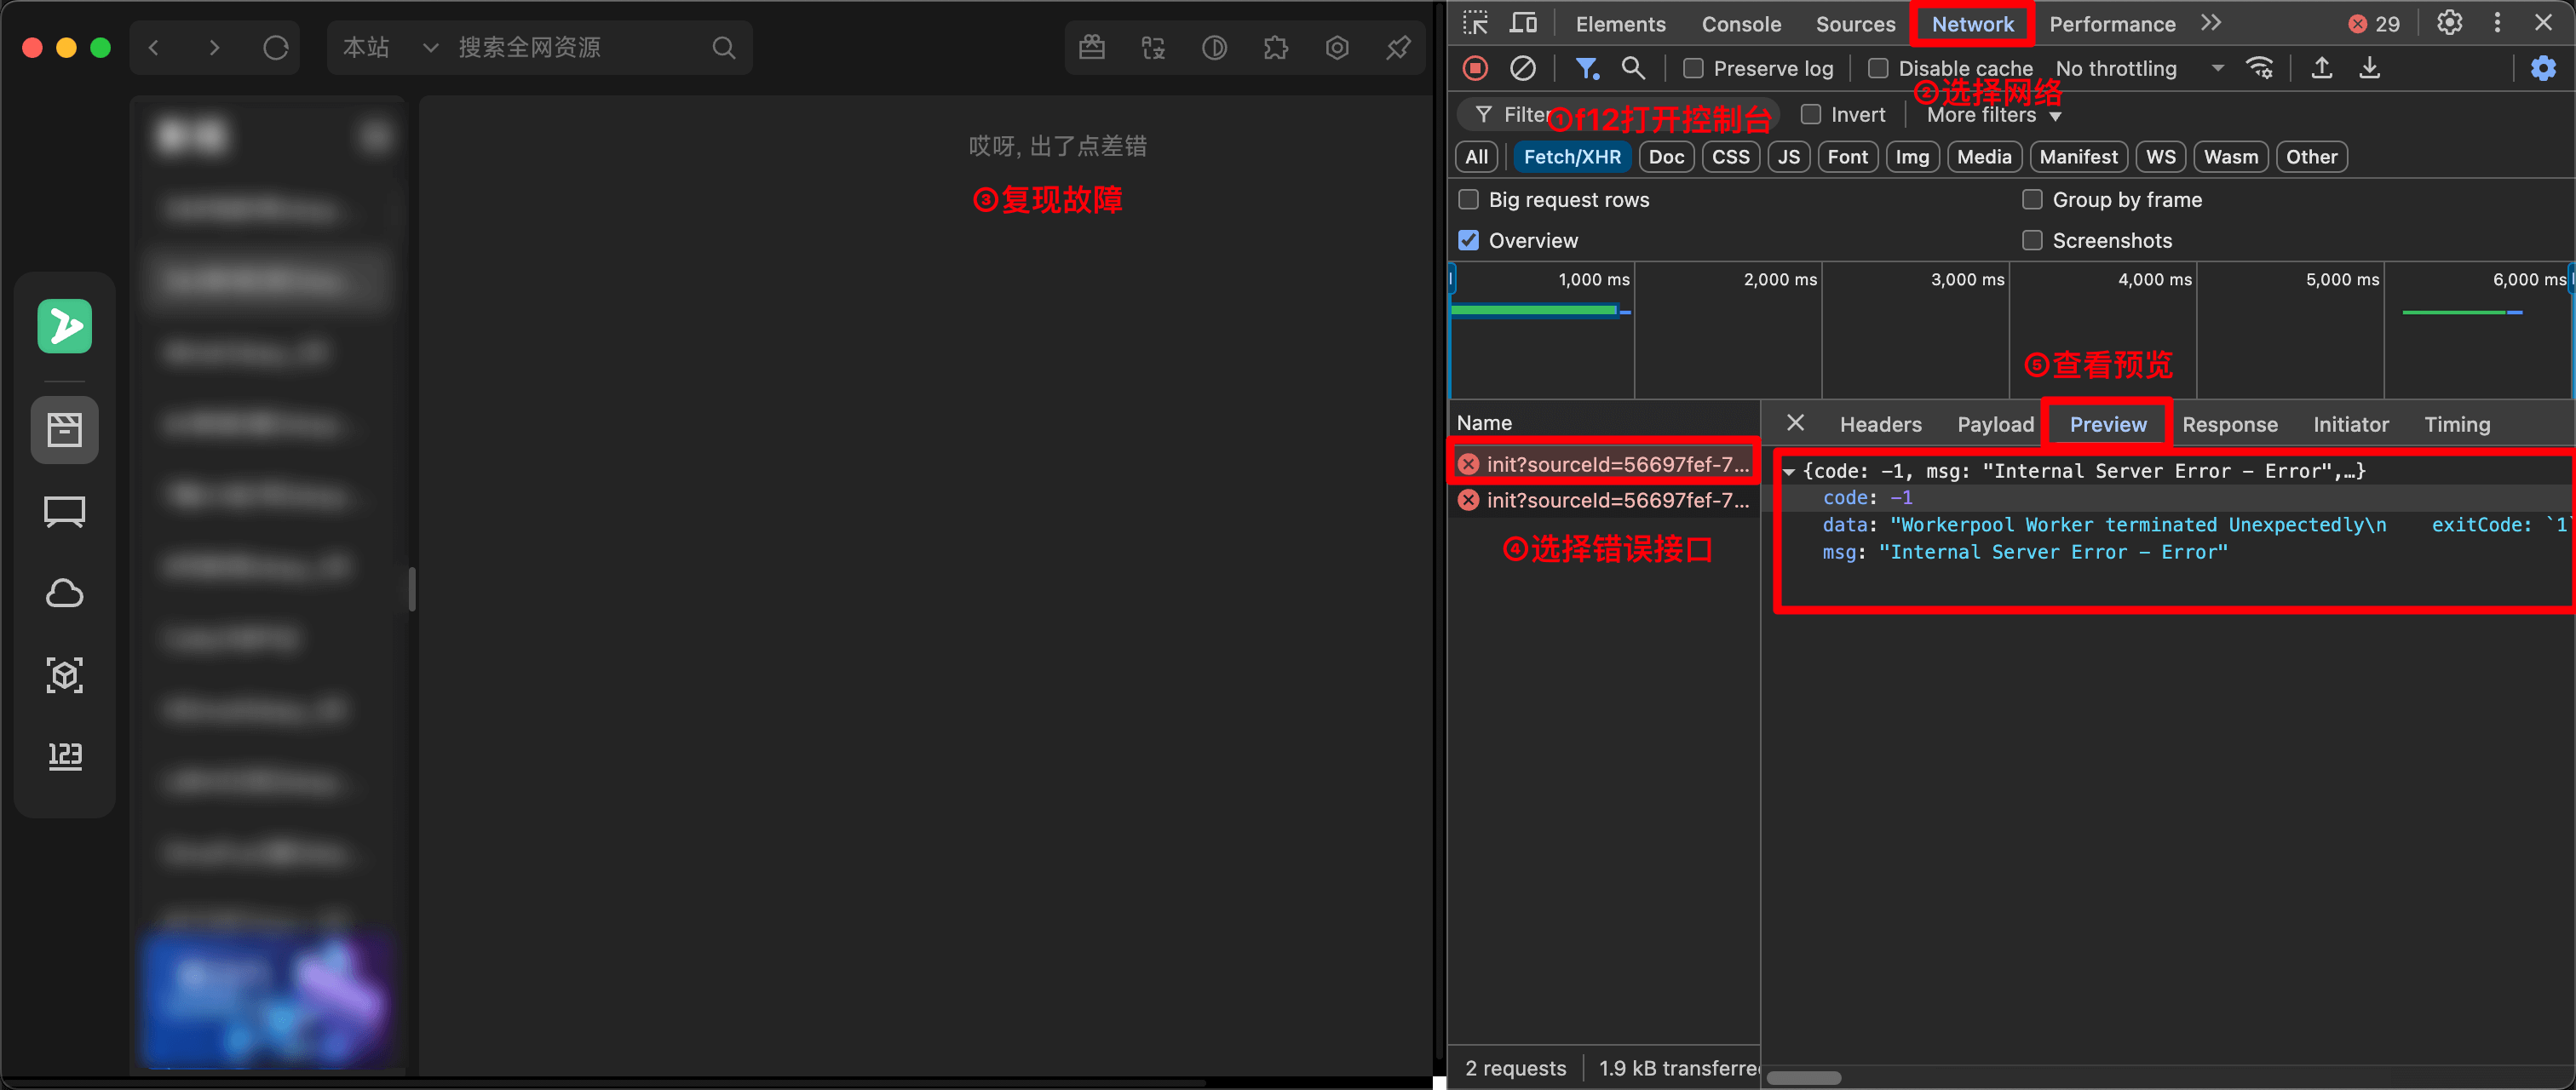
ai 查看代码(没错,就是我手动制造的奔溃)
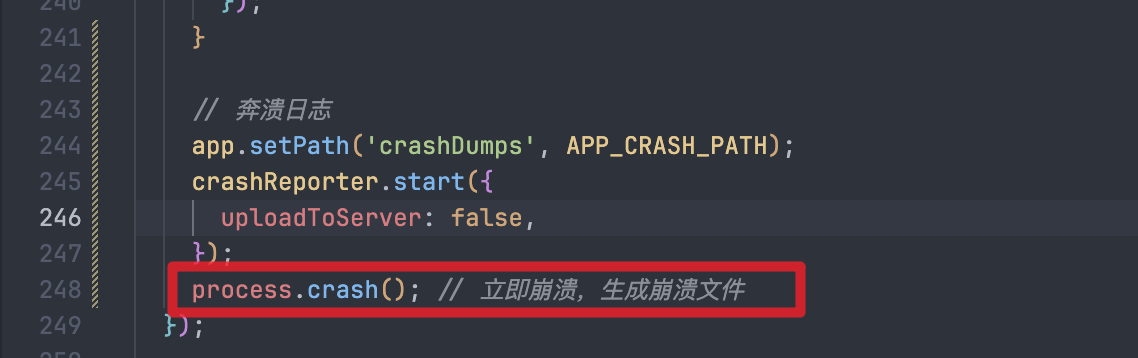
接口说明
定义-code:0 为成功, 其他为失败